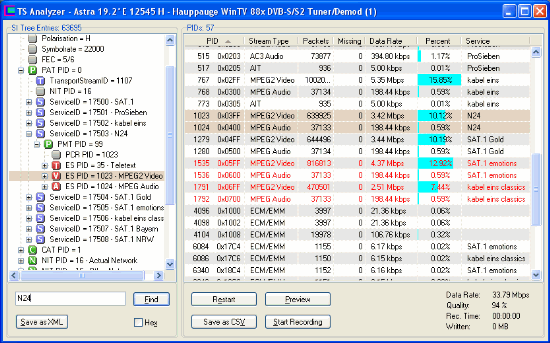
The TS Analyzer gives you a deep insight in what is broadcasted on a transponder. The right side of the Analyzer Window lists all streams that are present, the corresponding PIDs, stream types, plus statistics like packet count and data rate. The tree view on the left side reflects the content of the broadcasted Service Information (SI) Tables The Analyzer evaluates them bit by bit and translates them into a readable structure, thus providing all available information about networks, transponders, services, bouquets, events etc.
PID List | Hex View | SI Table Tree | Introduction to SI Tables
All streams on a transponder are multiplexed to one transport stream. Each stream within the transport stream is broadcasted as a series of data packets with a fixed size of 188 bytes, commencing with a four byte header, that contains a Packet Identifier (PID) – a number in the range from 0 to 8191. It indicates to which stream a packet belongs.
The PID List on the right side of the Analyzer Window shows all PIDs that are used on a transponder, plus the corresponding stream type, the stream's data rate and its percentage of the overall data rate. Encrypted streams are displayed in red. The „Missing“ column displays the number of missing data packets (each 188 bytes). They are detected by keeping track of the continuity counter in the TS packet header. Missing data packets are caused by bad reception, driver problems or overall transponder data rates exceeding the maximum data rate of a DVB device.
This part of the TS Analyzer offers the following possibilities:
![]()
 Adjust
the column widths by dragging the lines between the column
headers with the mouse.
Adjust
the column widths by dragging the lines between the column
headers with the mouse.
![]() Sort the list by PID value, stream type or data rate. Simply
click the corresponding column header. Clicking it again reverses
the sort order.
Sort the list by PID value, stream type or data rate. Simply
click the corresponding column header. Clicking it again reverses
the sort order.
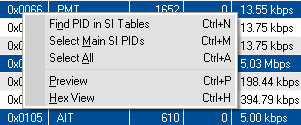
![]() Right-clicking an entry selects it and opens a context menu
that offers some useful commands.
Right-clicking an entry selects it and opens a context menu
that offers some useful commands.
![]() Find PID in SI Tables lets the Analyzer search the according
SI table entry in the treeview on the left side and display it,
enabling you to obtain more information about the stream in
question. The same can be achieved by double-clicking an
entry.
Find PID in SI Tables lets the Analyzer search the according
SI table entry in the treeview on the left side and display it,
enabling you to obtain more information about the stream in
question. The same can be achieved by double-clicking an
entry.
![]() Select Main SI PIDs: Selects all PIDs that are important for
scanning (PAT, SDT & PMT). This is helpful if you encounter
scanning issues in DVBViewer or TransEdit and want to support
debugging by providing a sample TS file. Select the affected
transponder, start the Analyzer, let it work for approx. 30 seconds,
select the relevant PIDs, record the selection for approx. 30
seconds (see below), zip the resulting TS file and attach it in the
DVBViewer forum or provide it elsewhere for download. If EPG issues
have to be handled, additionally select EIT PID 18 before you start
recording. It may increase the file size considerably, however.
Select Main SI PIDs: Selects all PIDs that are important for
scanning (PAT, SDT & PMT). This is helpful if you encounter
scanning issues in DVBViewer or TransEdit and want to support
debugging by providing a sample TS file. Select the affected
transponder, start the Analyzer, let it work for approx. 30 seconds,
select the relevant PIDs, record the selection for approx. 30
seconds (see below), zip the resulting TS file and attach it in the
DVBViewer forum or provide it elsewhere for download. If EPG issues
have to be handled, additionally select EIT PID 18 before you start
recording. It may increase the file size considerably, however.
![]() Select All does just what it says.
Select All does just what it says.
![]() Use „Select All“ if you want to record the whole
transponder (see below).
Use „Select All“ if you want to record the whole
transponder (see below).
![]() Preview does the same as „Find PID in SI Tables“,
but additionally opens the Preview
Window, in order to play the selected stream, if possible. If it
is an audio stream, a corresponding video stream will be played too,
and vice versa.
Preview does the same as „Find PID in SI Tables“,
but additionally opens the Preview
Window, in order to play the selected stream, if possible. If it
is an audio stream, a corresponding video stream will be played too,
and vice versa.
![]() Hex View opens the Hex View Window. It
captures data packets from the selected stream and displays their
„raw“ binary content as hexadecimal numbers – see
next section.
Hex View opens the Hex View Window. It
captures data packets from the selected stream and displays their
„raw“ binary content as hexadecimal numbers – see
next section.
The buttons below the PID List provide some more commands:
![]() Table Statistics: Tick this checkbox to let the Analyzer show
a panel with additional SI table statistics. Or more specific:
Section counters for each table type (PAT, CAT, NIT, PMT...),
allowing you to estimate the update frequency.
Table Statistics: Tick this checkbox to let the Analyzer show
a panel with additional SI table statistics. Or more specific:
Section counters for each table type (PAT, CAT, NIT, PMT...),
allowing you to estimate the update frequency.
![]() Restart resets the Analyzer and lets it rebuild the SI Table
Tree and the PID List from the scratch – in case you want to
check if anything has changed since you started the analysis. A
restart does not affect an ongoing recording, however.
Restart resets the Analyzer and lets it rebuild the SI Table
Tree and the PID List from the scratch – in case you want to
check if anything has changed since you started the analysis. A
restart does not affect an ongoing recording, however.
When the end of an analyzed TS file is reached, the Restart function additionally resets the read position to the beginning of the file. Reading the file again from the beginning can be forced by holding the Shift Key down while clicking the Restart Button.
![]() Save as CSV saves the whole PID List as a text file with the
extension .csv. The channel resp. service names (if available) are
appended to each line. The Analyzer stores the file in the folder
that has been selected on the Analyzer
Tab in the Settings Window. The file name is generated
automatically. It contains the name of the underlying transponder
list and the transponder frequency.
Save as CSV saves the whole PID List as a text file with the
extension .csv. The channel resp. service names (if available) are
appended to each line. The Analyzer stores the file in the folder
that has been selected on the Analyzer
Tab in the Settings Window. The file name is generated
automatically. It contains the name of the underlying transponder
list and the transponder frequency.
CSV means „Comma Separated Values“.
It is a text format that can be read by data base applications.
However, the Analyzer does not use commas to separate the values
resp, columns, but tab control characters (#9). Data base
applications should be able to handle this as well. It enables
displaying the list as a structured table in a text editor, provided
the editor allows to set a sufficient tab size (e. g. 14 characters).
Notepad does not, which makes the table look a bit orderless...
![]() Start Recording records the selected streams as TS file. For
selecting more than one entry with the mouse, hold the Ctrl or Shift
key down while clicking. The Analyzer stores the file in the folder
that has been selected on the Analyzer
Tab in the Settings Window. The file name is generated
automatically. It contains the name of the underlying transponder
list and the transponder frequency, plus the current date and time.
Start Recording records the selected streams as TS file. For
selecting more than one entry with the mouse, hold the Ctrl or Shift
key down while clicking. The Analyzer stores the file in the folder
that has been selected on the Analyzer
Tab in the Settings Window. The file name is generated
automatically. It contains the name of the underlying transponder
list and the transponder frequency, plus the current date and time.
After a recording has been started, the button's caption changes to Stop Recording. On the right the Analyzer displays the recording time and the file size.
The „Select PIDs“ and
„Add PIDs to Selection“ commands in the treeview
context menu facilitate selecting PIDs that belong to a certain
channel resp. service (see below).
A word about the overall data rate that is displayed at the lower right, and null packets. A DVB Transponder has a fixed data rate, and an unused portion must be stuffed somehow. This is done by inserting null packets with PID 8191 (0x1FFF). However, some DVB devices filter them out, so the Analyzer does not receive them. In this case the displayed overall data rate is not the transponder's true data rate, but just the sum of the listed streams. If null packets are displayed (as last stream in the list), the overall data rate is the measured data rate of the whole transponder.
contents | to the top | preceding chapter | next chapter
Sometimes it is necessary for developers and DVB professionals to inspect the raw content of a stream, as it is displayed in the Hex View Window. Open it by right-clicking the stream in the PID List and selecting „Hex View“ in the context menu.
The Hex View Window captures a number of data packets from the stream (188 bytes each), displays the bytes as hex numbers, and additionally on the right as ASCII characters, so you can see if there is readable text inside. Some data sections are marked with a background color:
![]() Blue marks the packet
header (always four bytes) .
Blue marks the packet
header (always four bytes) .
![]() Green marks an adaptation
field (a kind of optional header extension with variable length)
Green marks an adaptation
field (a kind of optional header extension with variable length)
![]() Orange marks PES headers
(the headers of a Packetized Elementary Stream within the transport
stream packets, mostly video, audio, teletext or DVB subtitles).
Orange marks PES headers
(the headers of a Packetized Elementary Stream within the transport
stream packets, mostly video, audio, teletext or DVB subtitles).
![]() Yellow
marks a pointer field and the following bytes, up to the beginning
of the SI table section to which the pointer field points.
Yellow
marks a pointer field and the following bytes, up to the beginning
of the SI table section to which the pointer field points.
![]() Gray
marks the ISO defined beginning resp. header common to all SI
sections (3 or 8 bytes dependent on the section syntax).
Gray
marks the ISO defined beginning resp. header common to all SI
sections (3 or 8 bytes dependent on the section syntax).
The bottom panel elements have the following meaning:
![]() Packets: Use this input field or the up-down-buttons to
adjust the maximum number of packets that you want to be captured.
Packets: Use this input field or the up-down-buttons to
adjust the maximum number of packets that you want to be captured.
![]() Wait for payload unit start: This checkbox specifies if the
payload unit start indicator (a special header bit) shall be set in
the first captured packet. The set bit indicates that a new data
unit starts within the packet, e.g an audio frame, and that a PES
header is present in case of a Packetized Elementary Stream, or a
pointer field in case of Service Information Tables. If the checkbox
is unticked, the Hex View Window does not wait for a set payload
unit start indicator when starting to capture, but takes the first
packet „as it comes“.
Wait for payload unit start: This checkbox specifies if the
payload unit start indicator (a special header bit) shall be set in
the first captured packet. The set bit indicates that a new data
unit starts within the packet, e.g an audio frame, and that a PES
header is present in case of a Packetized Elementary Stream, or a
pointer field in case of Service Information Tables. If the checkbox
is unticked, the Hex View Window does not wait for a set payload
unit start indicator when starting to capture, but takes the first
packet „as it comes“.
If the „Wait for payload unit
start“ checkbox is ticked, but the stream does not contain
such a packet, the Hex View Window will display nothing, even after
waiting some time. In this case change the settings and click
„Apply“.
![]() Save saves the content of the Hex View Window as text file.
The Analyzer stores the file in the folder that has been selected on
the Analyzer Tab in the
Settings Window. The file name is generated automatically. It
contains the PID, the name of the underlying transponder list and
the transponder frequency.
Save saves the content of the Hex View Window as text file.
The Analyzer stores the file in the folder that has been selected on
the Analyzer Tab in the
Settings Window. The file name is generated automatically. It
contains the PID, the name of the underlying transponder list and
the transponder frequency.
![]() Apply restarts the data dump in the Hex View Window with the
actual settings.
Apply restarts the data dump in the Hex View Window with the
actual settings.
contents | to the top | preceding chapter | next chapter
The TS Analyzer reads all Service Information (SI) Tables that are broadcasted on a transponder and displays them as a treeview on the left side. The tables contain tons of information about DVB networks, transponders, services, bouquets, events etc. DVB applications and receivers read at least parts of it, particularly when scanning, dynamically updating channels or collecting EPG data.
The SI tables are broadcasted as special binary streams, not as human-friendly textual information. They have to be translated in order to become readable, and that's what the TS Analyzer does for you. The „Introduction to SI Tables“ section explains important elements like PAT, PMT, NIT, SDT, EIT, ES and Descriptors. But let us first have a look at the functions that are available on the left side of the TS Analyzer:
![]()
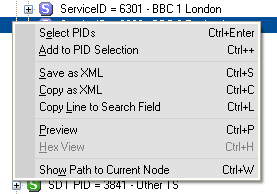 Right-clicking
an entry selects it and opens a context menu that offers some useful
commands.
Right-clicking
an entry selects it and opens a context menu that offers some useful
commands.
![]() Select PIDs selects all streams resp. PIDs in the PID
List that somehow belong to the selected tree node. E.g. if it
is a service node representing a TV channel, the Analyzer marks the
video stream, the audio stream, the teletext stream and any other
stream belonging to this channel, thereby erasing a previous
selection.
Select PIDs selects all streams resp. PIDs in the PID
List that somehow belong to the selected tree node. E.g. if it
is a service node representing a TV channel, the Analyzer marks the
video stream, the audio stream, the teletext stream and any other
stream belonging to this channel, thereby erasing a previous
selection.
![]() Add to PID Selection does the same as „Select PIDs“,
but adds the streams to an already existing selection.
Add to PID Selection does the same as „Select PIDs“,
but adds the streams to an already existing selection.
These two functions are useful for
selecting streams that shall be recorded as TS file. These commands
are only available if a node represents a service or a stream
(specifying a PID).The selection mechanism examines all parent and
child nodes of the selected node – brothers, uncles, cousins
etc. are not included – and checks if they specify a PID. If
yes, it is added to the selection. The PAT node contains the most
important information about services and streams. The Analyzer
redirects a service node outside the PAT to the corresponding service
entry within the PAT, when these functions are executed.
![]() Save as XML saves the selected node and all its children,
grandchildren etc as XML file in the folder that has been selected
on the Analyzer Tab in
the Settings Window. The file name is generated automatically. It
contains the name of the underlying transponder list and the
transponder frequency.
Save as XML saves the selected node and all its children,
grandchildren etc as XML file in the folder that has been selected
on the Analyzer Tab in
the Settings Window. The file name is generated automatically. It
contains the name of the underlying transponder list and the
transponder frequency.
![]() Copy as XML copies the selected node and all its children to
the Windows clipboard, by using the XML format.
Copy as XML copies the selected node and all its children to
the Windows clipboard, by using the XML format.
The XML format is a textual
representation of a tree structure, or with other words, a text
format that follows certain syntax rules, thus being readable for
humans and robots
![]() .
XML files can be opend with Notepad or a XML-capable browser like
Internet Explorer. Please note: Saving the whole tree as XML
may create such a large file, that it can not be digested by the
Internet Explorer anymore, at least not without paralyzing your PC.
.
XML files can be opend with Notepad or a XML-capable browser like
Internet Explorer. Please note: Saving the whole tree as XML
may create such a large file, that it can not be digested by the
Internet Explorer anymore, at least not without paralyzing your PC.
![]() Copy Line to Search Field copies the selected node's caption
(as displayed) to the search field below the treeview.
Copy Line to Search Field copies the selected node's caption
(as displayed) to the search field below the treeview.
![]() Hex View opens the Hex View Window. It
captures data packets from the selected stream and displays their
„raw“ binary content as hexadecimal numbers – see
previous section.
Hex View opens the Hex View Window. It
captures data packets from the selected stream and displays their
„raw“ binary content as hexadecimal numbers – see
previous section.
![]()
 Preview:
This function is only available if the selected node is related to a
service or a video resp. audio stream. It opens the Preview
Window, in order to play the selected channel or stream, if
possible. If it is an audio stream, a corresponding video stream
will be played too, and vice versa.
Preview:
This function is only available if the selected node is related to a
service or a video resp. audio stream. It opens the Preview
Window, in order to play the selected channel or stream, if
possible. If it is an audio stream, a corresponding video stream
will be played too, and vice versa.
![]() Show Path to Current Node: Lets an additional panel
(dis-)appear at the bottom, showing the path to to current node, in
case you got lost in the depth of a table tree with thousands of
entries. If this option is switched on, the path to the current node
shows up as soon as you select an entry in the third or a deeper
tree level - that's where navigation may get a bit awkward. You may
also use the path for returning to one of the current node's
ancestors by clicking on it. Clicking the panel's title area
switches the option off.
Show Path to Current Node: Lets an additional panel
(dis-)appear at the bottom, showing the path to to current node, in
case you got lost in the depth of a table tree with thousands of
entries. If this option is switched on, the path to the current node
shows up as soon as you select an entry in the third or a deeper
tree level - that's where navigation may get a bit awkward. You may
also use the path for returning to one of the current node's
ancestors by clicking on it. Clicking the panel's title area
switches the option off.
The area below the treeview provides shortcuts for the „Save as XML“ and „Preview“ functions, plus additional elements:
![]() Search: The search function helps you to find an item in the
treeview. Enter it in the input line, e. g. „DVB-S2“, if
you want to find DVB-S2 transponders that are listed in the Network
Information Table (NIT). Then click „Search“. The
Analyzer begins the search right after the selected entry, down to
the bottom, and, in case the item can't be found there, continues
with the first (topmost) tree entry. If no entry is selected, it
begins with the first. A found entry will be selected and displayed.
Click „Search“ repeatedly to find all
occurrences.
Search: The search function helps you to find an item in the
treeview. Enter it in the input line, e. g. „DVB-S2“, if
you want to find DVB-S2 transponders that are listed in the Network
Information Table (NIT). Then click „Search“. The
Analyzer begins the search right after the selected entry, down to
the bottom, and, in case the item can't be found there, continues
with the first (topmost) tree entry. If no entry is selected, it
begins with the first. A found entry will be selected and displayed.
Click „Search“ repeatedly to find all
occurrences.
![]() Hex: This checkbox enables displaying certain IDs as
hexadecimal or decimal numbers, as you like – particularly
PIDs, Service IDs, Transportstream IDs, Network IDs, Bouquet IDs and
Event IDs. Tick the hexbox
Hex: This checkbox enables displaying certain IDs as
hexadecimal or decimal numbers, as you like – particularly
PIDs, Service IDs, Transportstream IDs, Network IDs, Bouquet IDs and
Event IDs. Tick the hexbox
![]() for a hexadecimal and untick it for a decimal representation. This
function also affects the XML export.
for a hexadecimal and untick it for a decimal representation. This
function also affects the XML export.
contents | to the top | preceding chapter | next chapter
Now let's have a look at the different kind of data that is displayed in the treeview, and what can be found where.
The right side of the tree node's
captions – after the hyphen – is not part of the original
SI Table entries, but added by the Analyzer to make them
comprehensible. Partly the descriptions originate from Analyzer
tables, that translate values into names, partly from a special
name-giver instance, that collects all IDs and names from the SI
Tables (e.g. from Service Descriptors) and assigns them to each
other.
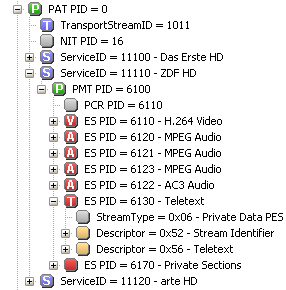 The
most important section is the PAT (Program Association Table).
Its structure is quite simple. The first entry is a Transportstream
ID, that allows to identify the transponder within the network
(e. g. a satellite position), followed by a list of all services
resp. channels that are broadcasting on the transponder. A Service
ID is assigned to each service, that is unique within the
transponder.
The
most important section is the PAT (Program Association Table).
Its structure is quite simple. The first entry is a Transportstream
ID, that allows to identify the transponder within the network
(e. g. a satellite position), followed by a list of all services
resp. channels that are broadcasting on the transponder. A Service
ID is assigned to each service, that is unique within the
transponder.
Each service entry contains a PMT PID. That is a kind of „link“ to another table, the PMT (Program Map Table) of the corresponding service. Though the PMTs are broadcasted in separate streams, the Analyzer puts them into the PAT section, in order to show which PMT belongs to which service.
The PMT basically lists all Elementary Streams (ES), that belong to a service resp. channel, and their corresponding PIDs. The list is usually seasoned with some Descriptors. That are sub-structures within SI tables, specifying properties of services, streams etc. in detail, for example the language of an audio stream, or the teletext initial page.
You will find scores of descriptors in the SI tables. The Analyzer decodes and translates most of them into text, except those, that are unknown to the internal translator yet, or that are user defined, which means, used by the broadcasters for „private“ purpose, without following official specifications. In this case the Analyzer displays the content as a number of hex bytes, and (sometimes) additionally as characters, so you can see if there is text hidden inside.
The CAT (Conditional Access Table) contains Conditional Access Descriptors, providing information about the encryption systems (e.g. Viaccess or Cryptoworks) that are used on the transponder, and the packet identifiers (PIDs) of the corresponding ECM/EMM streams. These “Entitlement Control Messages” and “Entitlement Management Messages” provide information about the authority a viewer has to acquire reception.
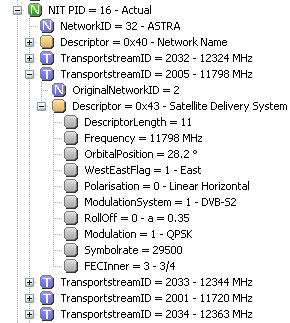 Another
important section is the NIT (Network Information Table). It
lists transport streams that are available in a network, e. g. a
cable network, a terrestrial region, a satellite position, or a
subdivision that is occupied by a certain provider. A transport
stream is the sum of all streams that are broadcasted on a
transponder. Within the network it is identified by its
Transportstream ID.
Another
important section is the NIT (Network Information Table). It
lists transport streams that are available in a network, e. g. a
cable network, a terrestrial region, a satellite position, or a
subdivision that is occupied by a certain provider. A transport
stream is the sum of all streams that are broadcasted on a
transponder. Within the network it is identified by its
Transportstream ID.
The NIT also contains descriptors, of course. Linkage Descriptors point to services that provide additional information about the network and specify where they are located. Within the transport stream nodes there are Satellite / Cable / Terrestrial Delivery System Descriptors, providing technical information about the transponder, e. g. its frequency, symbol rate, modulation etc. TransEdit reads them, if you use the Update Function for updating a transponder list.
The amount of information in Network Information Tables varies. A DVB-T transponder may only provide a description of itself, due to the limited terrestrial data rate – saving bits and bytes is mandatory. On major satellite positions like Astra the NIT usually lists all active transponders. And even more: There may be an additional NIT present that refers to other networks. e. g. to Astra 23° East on Astra 19° East. In this case the Analyzer displays two separate entries: NIT – Actual Network for the actual network and NIT – Other Network for other networks.
The next one: SDT. Service Descriptor Table. Again a list of services, like the one in the PAT, but providing additional information. E. g. whether a service is running at the time (Running Status). Whether it only provides EPG information about the present and following broadcast (EIT Present-Following Flag) or a more comprehensive EPG for several days (EIT Schedule Flag). Whether one or more streams of the service are encrypted (Free CA mode is 1 in this case). And most important: Service Descriptors containing the service and provider names. Now you know why the TransEdit scanner must read the PAT, PMT and SDT. Without the SDT information found channels would only appear as „Service xxxx“.
Besides the SDT – Actual TS, the Analyzer may list a SDT – Other TS, that informs about services in other networks resp. on other transponders. The channels belonging to a provider may be spread over several transponders, or be present in more than one network. The whole collection is nicely called a Bouquet. The provider may use the SDT–Other sub-table to provide information about all its activities on each transponder.
That brings us to the next table: BAT. Bouquet Association Table. Besides Bouquet Name Descriptors you may find there Linkage Descriptors – links to other transponders, where parts of a bouquet are present – and a list of Transportstream IDs, denoting associated transponders. Each list entry may contain a Service List Descriptor, enumerating which services of the bouquet can be found in that transport stream. Quite nested, as you can see.
 However,
it can even get worse. The EIT (Event Information Table) is
the most extensive DVB data collection. In order to make it more
handy it is divided into four sub-tables:
However,
it can even get worse. The EIT (Event Information Table) is
the most extensive DVB data collection. In order to make it more
handy it is divided into four sub-tables:
![]() EIT – Actual TS, Present/Following: Contains EPG data
for current and subsequent broadcasts in the actual transport
stream.
EIT – Actual TS, Present/Following: Contains EPG data
for current and subsequent broadcasts in the actual transport
stream.
![]() EIT – Actual TS, Schedule: Contains chronologically
ordered long-term EPG data for the actual transport stream. It
depends on the provider which period of time is covered.
EIT – Actual TS, Schedule: Contains chronologically
ordered long-term EPG data for the actual transport stream. It
depends on the provider which period of time is covered.
![]() EIT – Other TS, Present/Following: Contains EPG data
for current and subsequent broadcasts in other transport streams
resp. DVB networks.
EIT – Other TS, Present/Following: Contains EPG data
for current and subsequent broadcasts in other transport streams
resp. DVB networks.
![]() EIT – Other TS, Schedule: Contains chronologically
ordered long-term EPG data for other transport streams resp. DVB
networks. It depends on the provider if at all and to which extent.
EIT – Other TS, Schedule: Contains chronologically
ordered long-term EPG data for other transport streams resp. DVB
networks. It depends on the provider if at all and to which extent.
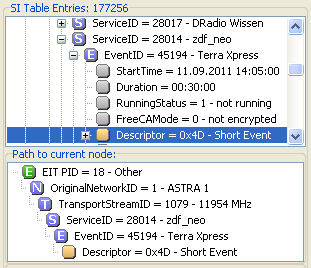
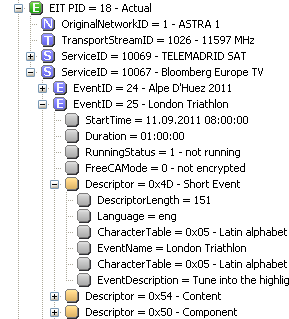
After expanding a EIT – Actual TS
node you will first see a list of services. Within each service
entry, a list of events, identified by Event IDs. And within
each event entry, besides the start time, duration and other status
information, a lot of descriptors. The most important of them are
Short Event Descriptors, containing the title and a short
description of the broadcast, and Extended Event Descriptors,
providing a long description – often spread over several of
those descriptors, because a single descriptor can not contain more
than 255 bytes. And, not to forget, Content Descriptors,
informing you about the event type – e. g., movie, classical
drama, soap or football transmission, in case you are not sure what
it is supposed to be
![]()
And now things really get a bit complex. In EIT – Other TS tables the first level is a list of networks, identified by Network IDs. If you are lucky, only one entry. Within each network entry a list of Transportstream IDs. Within each transport stream entry a list of Service IDs. Within each service entry a list of Event IDs... well, we better stop here. Now you know why the Analyzer Tab in the Settings Window allows to exclude the EIT or parts of it. It may simply get too much for your poor old PC...
All times of day are presented by the
Analyzer as they are broadcasted. That means, as UTC
(Coordinated Universal Time) which is the same as the formerly used
GMT (Greenwich Mean Time). For obtaining your local time of day you
have to add or subtract a time offset, that depends on where you live
and if daylight saving time is in effect. DVBViewer shows the time
zone offset in the Options Window.
This also applies to the last two tables in our collection – luckily small ones. The TDT (Time Date Table) simply contains the current date and time as UTC. It is mandatory on DVB transponders. The update frequency depends on the broadcaster. The extended TOT (Time Offset Table) may additionally contain a Local Time Offset Descriptor, providing a list of countries (though only one entry may be present), and for each country the time offset, whether it must be added to the UTC (Local Time Offset Polarity = 0) or subtracted (= 1), the next time of change (when daylight saving time takes effect) and the resulting new time offset.
To conclude this excursion: This manual only shows the tip of the iceberg. It gives a rough overview, in order to assist your first steps into the interior DVB world. If you want to dig deeper, search the web – you will find tons of information about DVB.
Unfortunately the basic ISO/IEC 13818-1
specifications, describing PAT, PMT, CAT and the composition of a
transport stream, are not available for free, in contrast to the
ISO-based DVB specifications ETSI EN 300 468 that are easy to find in
the internet. You will get a very professional, very technical PDF
file, that will teach you everything you need to know about the
remaining tables and descriptors.
contents | to the top | preceding chapter | next chapter